



GATE CS 2017 (Afternoon) — Question 65

Quantitative AptitudeGraphical Representations (2D and 3D Plots, Maps, Tables)MCQ2 marks · −2/3 if wrongMedium

An air pressure contour line joins locations in a region having the same atmospheric pressure. The following is an air pressure contour plot is a geographical region. Contour lines are shown at 0.05 bar intervals in this plot.
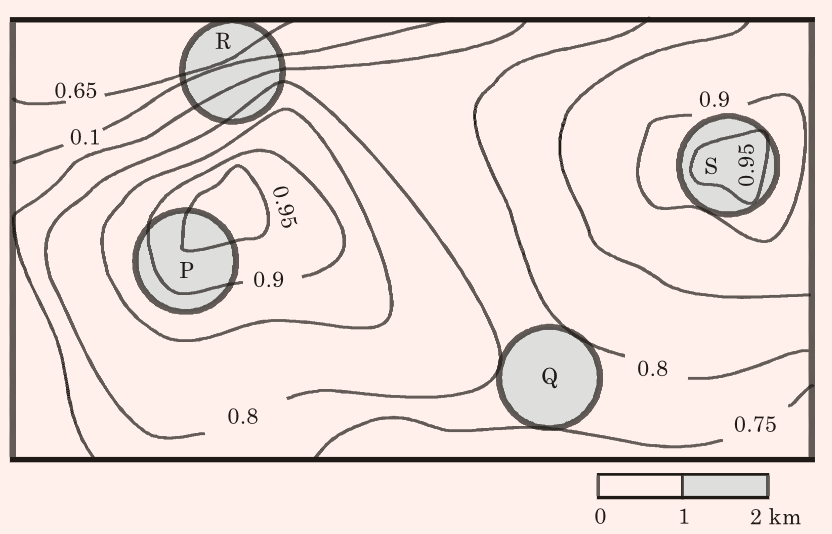
Question image
If the possibility of a thunderstorm is given by how fast air pressure rises or drops over a region, which of the following regions is most likely to have a thunderstorm?
  1. A
    P
  2. B
    Q
  3. C
    R
  4. D
    S
Practise the full 2017-AN paper
Challenge a friend: WhatsApp Telegram
Recommended book · affiliate linkIntroduction to Algorithms (CLRS)The standard reference behind most GATE algorithm questions.
Practise more on Graphical Representations (2D and 3D Plots, Maps, Tables)Timed, in the real exam interface · free to start

A GATE question every morning

One real past-paper question every morning for your branch, answer hidden until you tap. Free on Telegram.

Join
Stuck? Ask in the student group