



GATE CS 2021 (Afternoon) — Question 9

Quantitative AptitudeData Interpretation (Bar Graphs, Pie Charts, Histograms)MCQ2 marks · −2/3 if wrongMedium

The number of units of a product sold in three different years and the respective net profits are presented in the figure above. The cost/unit in Year 3 was Rs. 1, which was half the cost/unit in year 2. The cost/unit in year 3 was one-third of the cost/unit in year 1. Taxes were paid on the selling price at 10%, 13% and 15% respectively for the three years. Net profit is calculated as the difference between the selling price and the sum of cost and taxes paid in that year.
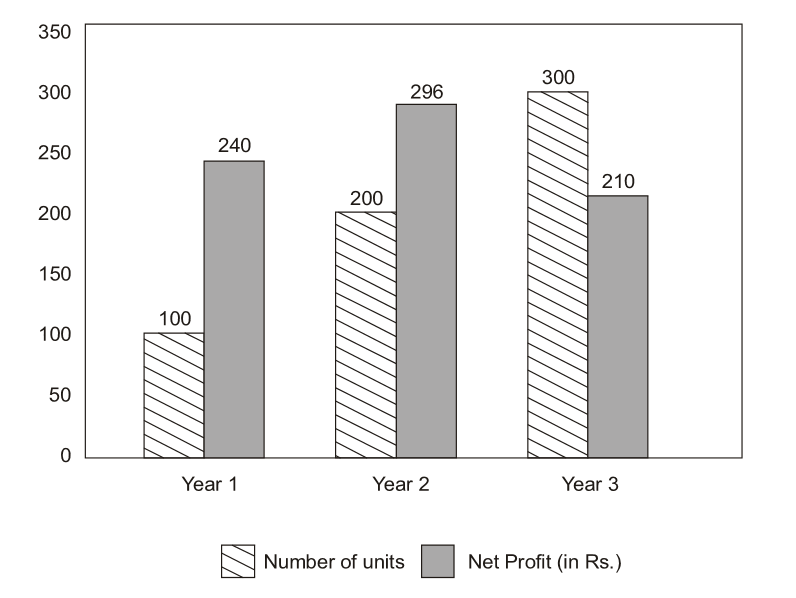
Question image
The ratio of the selling price in Year 2 to the selling price in Year 3 is _________.
  1. A
    4 : 3
  2. B
    1 : 1
  3. C
    3 : 4
  4. D
    1 : 2
Practise the full 2021-AN paper
Challenge a friend: WhatsApp Telegram
Recommended book · affiliate linkIntroduction to Algorithms (CLRS)The standard reference behind most GATE algorithm questions.
Practise more on Data Interpretation (Bar Graphs, Pie Charts, Histograms)Timed, in the real exam interface · free to start

A GATE question every morning

One real past-paper question every morning for your branch, answer hidden until you tap. Free on Telegram.

Join
Stuck? Ask in the student group