


GATE CS 2024 (Afternoon) — Question 8

Quantitative AptitudeData Interpretation (Bar Graphs, Pie Charts, Histograms)MCQ2 marks · −2/3 if wrongMedium

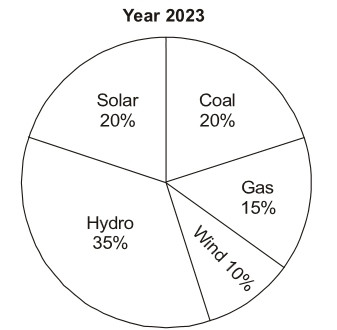
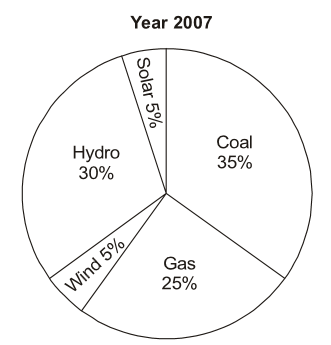
The pie charts depict the shares of various power generation technologies in the total electricity generation of a country for the years 2007 and 2023.
Question image
Question image
The renewable sources of electricity generation consist of Hydro, Solar and Wind. Assuming that the total electricity generated remains the same from 2007 to 2023, what is the percentage increase in the share of the renewable sources of electricity generation over this period?
  1. A
    25%
  2. B
    50%
  3. C
    77.5%
  4. D
    62.5%
Practise the full 2024-AN paper
Challenge a friend: WhatsApp Telegram
Recommended book · affiliate linkIntroduction to Algorithms (CLRS)The standard reference behind most GATE algorithm questions.
Practise more on Data Interpretation (Bar Graphs, Pie Charts, Histograms)Timed, in the real exam interface · free to start

A GATE question every morning

One real past-paper question every morning for your branch, answer hidden until you tap. Free on Telegram.

Join
Stuck? Ask in the student group