



GATE CS 2024 (Forenoon) — Question 8

Quantitative AptitudeData Interpretation (Bar Graphs, Pie Charts, Histograms)MCQ2 marks · −2/3 if wrongMedium

The pie chart present the percentage contribution of different macronutrients to a typical 2,000 kcal diet of a person.
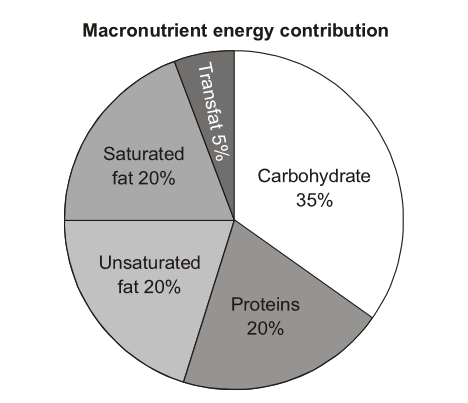
Question image
The typical energy density (kcal/g) of these macoutrients is given in the table.
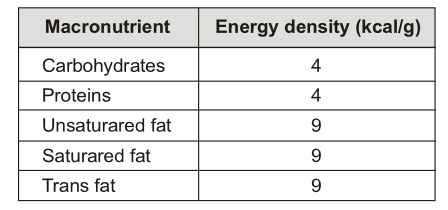
Question image
The total fat (all three types), in grams, this person consumes is
  1. A
    44.4
  2. B
    77.8
  3. C
    100
  4. D
    3,600
Practise the full 2024-FN paper
Challenge a friend: WhatsApp Telegram
Recommended book · affiliate linkIntroduction to Algorithms (CLRS)The standard reference behind most GATE algorithm questions.
Practise more on Data Interpretation (Bar Graphs, Pie Charts, Histograms)Timed, in the real exam interface · free to start

A GATE question every morning

One real past-paper question every morning for your branch, answer hidden until you tap. Free on Telegram.

Join
Stuck? Ask in the student group